Public Transportation Contact Info
Metropolitan Transit Authority
130 Nestor Street
P.O. Box 100270
Nashville, TN 37224-0270
615-862-6147
Web site
Public Transportation Coverage - Bus Transport
The following map illustrates those areas of Nashville that have easy access to public transportation.
Easy access is defined as no more than a one-half mile walk from a bus route. Bus stop information is ignored.
In cases of overlapping transit authorities, the transit system in review is shown in light purple and all other transit systems are shown in yellow.
Source: Federal Transit Administration and Synergos Technologies, Inc.
Selected Public Transportation Stats
The following tables and charts give a financial and operations overview of the public transportation network in Nashville.
Source: Federal Transit Administration - National Transit Database (1996-1998) and Synergos Technologies, Inc.
System Wide Information
General Information Service Area Statistics Square Miles Population Service Consumption Annual Passenger Miles Annual Unlinked Trips Average Weekday Unlinked Trips Average Saturday Unlinked Trips Average Sunday Unlinked Trips Service Supplied Annual Vehicle Revenue Miles Annual Vehicle Revenue Hours Veh. Available for Max. Service Veh. Operated in Max. Service Base Period Requirement Financial Information Fare Revenues Earned Directly Operated Purchased Transportation Total Fare Revenues Earned Sources of Operating Funds Expended Passenger Fares Local Funds State Funds Federal Assistance Other Funds Total Operating Funds Expended Summary of Operating Expenses Salaries, Wages and Benefits Materials and Supplies Purchased Transportation * Other Operating Expenses Total Operating Expenses Reconciling Cash Expenditures Sources of Capital Funds Local Funds State Funds Federal Assistance Total Sources Uses of Capital Funds Rolling Stock Facilites and Other Total Uses | 1997 529 528,103 28,834,581 6,888,556 20,127 20,714 11,812 4,430,014 319,615 174 131 46 6,145,117 0 6,145,117 6,145,117 6,395,375 2,068,535 880,523 694,511 16,184,061 13,173,124 2,112,681 0 1,644,521 16,930,326 15,129 281,835 281,835 7,062,871 7,626,541 3,389,663 4,236,878 7,626,541 | 1998 529 528,103 32,122,355 5,955,085 17,446 16,919 11,243 5,391,110 347,563 209 159 46 6,414,751 0 6,414,751 6,414,751 7,674,392 2,156,968 2,520,804 608,168 19,375,083 14,118,805 3,586,185 0 1,759,870 19,464,860 (7,183) 701,189 701,189 4,519,355 5,921,733 4,207,606 1,714,127 5,921,733 | Change Over Prior Yr 0 0 3,287,774 (933,471) (2,681) (3,795) (569) 961,096 27,948 35 28 0 269,634 0 269,634 269,634 1,279,017 88,433 1,640,281 (86,343) 3,191,022 945,681 1,473,504 0 115,349 2,534,534 (22,312) 419,354 419,354 (2,543,516) (1,704,808) 817,943 (2,522,751) (1,704,808) | 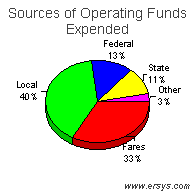 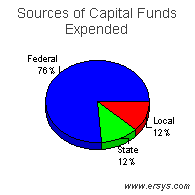 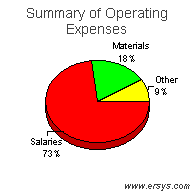 |
Mode of Transportation Breakout Information
Bus | Demand Response | |
| Operating Expense Capital Funding Rolling Stock Facilites and Other Annual Passenger Miles Annual Vehicle Revenue Miles Annual Vehicle Revenue Hours Annual Unlinked Trips Average Weekday Unlinked Trips Fixed Guideway Directional Route Miles Vehicles Available for Maximum Service Vehicles Operated in Maximum Service Directly Operated Purchased Transportation Average Fleet Age in Years Peak to Base Ratio Percent Spares Safety Incidents Injuries Fatalities Performance Measures Service Efficiency Operating Expense per Vehicle Revenue Mile Operating Expense per Vehicle Revenue Hour Cost Effectiveness Operating Expense per Passenger Mile Operating Expense per Unlinked Passenger Trip Service Effectiveness Unlinked Passenger Trips per Vehicle Revenue Mile Unlinked Passenger Trips per Vehicle Revenue Hour | $16,773,447 5,921,733 4,207,606 1,714,127 26,046,650 3,783,705 275,661 5,745,585 16,568 .0 140 105 105 0 10.2 2.3 33% 33 39 0 4.43 60.85 0.64 2.92 1.52 20.84 | $2,387,553 0 0 0 1,042,866 881,214 54,505 99,281 369 .0 34 26 26 0 8.1 .0 31% 13 7 0 2.71 43.80 2.29 24.05 0.11 1.82 |