Public Transportation Contact Info
Ben Franklin Transit
1000 Columbia Drive, S.E.
Richland, WA 99352
509-735-4131
Web site
Public Transportation Coverage - Bus Transport
The following map illustrates those areas of Richland that have easy access to public transportation.
Easy access is defined as no more than a one-half mile walk from a bus route. Bus stop information is ignored.
In cases of overlapping transit authorities, the transit system in review is shown in light purple and all other transit systems are shown in yellow.
Source: Federal Transit Administration and Synergos Technologies, Inc.
Selected Public Transportation Stats
The following tables and charts give a financial and operations overview of the public transportation network in Richland.
Source: Federal Transit Administration - National Transit Database (1996-1998) and Synergos Technologies, Inc.
System Wide Information
General Information Service Area Statistics Square Miles Population Service Consumption Annual Passenger Miles Annual Unlinked Trips Average Weekday Unlinked Trips Average Saturday Unlinked Trips Average Sunday Unlinked Trips Service Supplied Annual Vehicle Revenue Miles Annual Vehicle Revenue Hours Veh. Available for Max. Service Veh. Operated in Max. Service Base Period Requirement Financial Information Fare Revenues Earned Directly Operated Purchased Transportation Total Fare Revenues Earned Sources of Operating Funds Expended Passenger Fares Local Funds State Funds Federal Assistance Other Funds Total Operating Funds Expended Summary of Operating Expenses Salaries, Wages and Benefits Materials and Supplies Purchased Transportation * Other Operating Expenses Total Operating Expenses Reconciling Cash Expenditures Sources of Capital Funds Local Funds State Funds Federal Assistance Total Sources Uses of Capital Funds Rolling Stock Facilites and Other Total Uses | 1997 110 137,565 48,331,486 4,675,965 16,459 9,210 0 5,339,563 274,539 233 216 28 1,261,167 32,681 1,293,848 1,293,848 0 11,357,393 0 1,058,697 13,709,938 8,819,007 1,787,468 799,493 1,442,543 12,848,511 861,427 0 0 350,719 350,719 73,537 277,182 350,719 | 1998 110 137,565 48,390,280 4,645,443 16,275 9,393 0 5,641,617 284,609 234 219 28 1,242,237 96,471 1,338,708 1,338,708 0 12,426,526 0 848,294 14,613,528 9,808,330 1,648,766 1,087,632 1,476,709 14,021,437 592,091 0 0 201,322 201,322 0 201,322 201,322 | Change Over Prior Yr 0 0 58,794 (30,522) (184) 183 0 302,054 10,070 1 3 0 (18,930) 63,790 44,860 44,860 0 1,069,133 0 (210,403) 903,590 989,323 (138,702) 288,139 34,166 1,172,926 (269,336) 0 0 (149,397) (149,397) (73,537) (75,860) (149,397) | 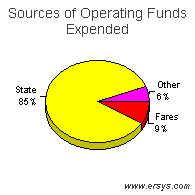 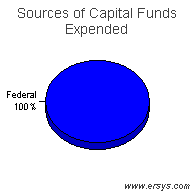 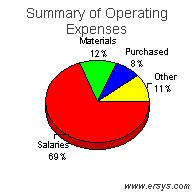 |
Mode of Transportation Breakout Information
Bus | Demand Response | |
| Operating Expense Capital Funding Rolling Stock Facilites and Other Annual Passenger Miles Annual Vehicle Revenue Miles Annual Vehicle Revenue Hours Annual Unlinked Trips Average Weekday Unlinked Trips Fixed Guideway Directional Route Miles Vehicles Available for Maximum Service Vehicles Operated in Maximum Service Directly Operated Purchased Transportation Average Fleet Age in Years Peak to Base Ratio Percent Spares Safety Incidents Injuries Fatalities Performance Measures Service Efficiency Operating Expense per Vehicle Revenue Mile Operating Expense per Vehicle Revenue Hour Cost Effectiveness Operating Expense per Passenger Mile Operating Expense per Unlinked Passenger Trip Service Effectiveness Unlinked Passenger Trips per Vehicle Revenue Mile Unlinked Passenger Trips per Vehicle Revenue Hour | $7,833,406 201,322 0 201,322 26,356,121 2,473,045 146,671 3,806,833 13,147 .0 58 49 49 0 11.3 1.8 18% 10 6 0 3.17 53.41 0.30 2.06 1.54 25.95 | $5,207,679 0 0 0 2,605,295 1,517,372 92,626 330,450 1,143 .0 65 62 38 24 4.2 .0 5% 7 6 0 3.43 56.22 2.00 15.76 0.22 3.57 |