Public Transportation Contact Info
Greater Roanoke Transit Company, Valley Metro
1108 Campbell Avenue, S.E.
P.O. Box 13247
Roanoke, VA 24032
540-982-0305
Public Transportation Coverage - Bus Transport
The following map illustrates those areas of Roanoke that have easy access to public transportation.
Easy access is defined as no more than a one-half mile walk from a bus route. Bus stop information is ignored.
In cases of overlapping transit authorities, the transit system in review is shown in light purple and all other transit systems are shown in yellow.
Source: Federal Transit Administration and Synergos Technologies, Inc.
Selected Public Transportation Stats
The following tables and charts give a financial and operations overview of the public transportation network in Roanoke.
Source: Federal Transit Administration - National Transit Database (1996-1998) and Synergos Technologies, Inc.
System Wide Information
General Information Service Area Statistics Square Miles Population Service Consumption Annual Passenger Miles Annual Unlinked Trips Average Weekday Unlinked Trips Average Saturday Unlinked Trips Average Sunday Unlinked Trips Service Supplied Annual Vehicle Revenue Miles Annual Vehicle Revenue Hours Veh. Available for Max. Service Veh. Operated in Max. Service Base Period Requirement Financial Information Fare Revenues Earned Directly Operated Purchased Transportation Total Fare Revenues Earned Sources of Operating Funds Expended Passenger Fares Local Funds State Funds Federal Assistance Other Funds Total Operating Funds Expended Summary of Operating Expenses Salaries, Wages and Benefits Materials and Supplies Purchased Transportation * Other Operating Expenses Total Operating Expenses Reconciling Cash Expenditures Sources of Capital Funds Local Funds State Funds Federal Assistance Total Sources Uses of Capital Funds Rolling Stock Facilites and Other Total Uses | 1997 43 96,000 6,423,483 1,814,506 6,281 4,244 0 1,478,220 113,678 50 42 16 1,477,746 0 1,477,746 1,281,829 803,426 869,606 574,147 226,407 3,755,415 2,445,000 412,744 280,192 617,479 3,755,415 0 4,731 4,731 37,850 47,312 47,312 0 47,312 | 1998 43 96,000 7,291,086 1,868,554 6,300 4,892 0 1,452,455 114,782 51 43 16 1,533,577 37,080 1,570,657 1,326,082 710,372 988,420 574,147 244,575 3,843,596 2,539,653 367,438 300,093 636,412 3,843,596 0 24,944 24,942 199,541 249,427 11,203 238,224 249,427 | Change Over Prior Yr 0 0 867,603 54,048 19 648 0 (25,765) 1,104 1 1 0 55,831 37,080 92,911 44,253 (93,054) 118,814 0 18,168 88,181 94,653 (45,306) 19,901 18,933 88,181 0 20,213 20,211 161,691 202,115 (36,109) 238,224 202,115 | 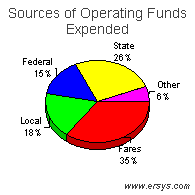 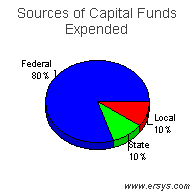 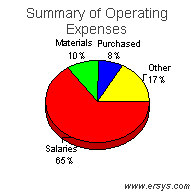 |
Mode of Transportation Breakout Information
Bus | Demand Response | |
| Operating Expense Capital Funding Rolling Stock Facilites and Other Annual Passenger Miles Annual Vehicle Revenue Miles Annual Vehicle Revenue Hours Annual Unlinked Trips Average Weekday Unlinked Trips Fixed Guideway Directional Route Miles Vehicles Available for Maximum Service Vehicles Operated in Maximum Service Directly Operated Purchased Transportation Average Fleet Age in Years Peak to Base Ratio Percent Spares Safety Incidents Injuries Fatalities Performance Measures Service Efficiency Operating Expense per Vehicle Revenue Mile Operating Expense per Vehicle Revenue Hour Cost Effectiveness Operating Expense per Passenger Mile Operating Expense per Unlinked Passenger Trip Service Effectiveness Unlinked Passenger Trips per Vehicle Revenue Mile Unlinked Passenger Trips per Vehicle Revenue Hour | $3,543,503 249,427 11,203 238,224 7,026,642 1,188,011 94,138 1,839,435 6,191 .0 38 30 30 0 6.4 1.9 27% 21 21 0 2.98 37.64 0.50 1.93 1.55 19.54 | $300,093 0 0 0 264,444 264,444 20,644 29,119 109 .0 13 13 0 13 4.3 .0 % 0 0 0 1.13 14.54 1.13 10.31 0.11 1.41 |