Public Transportation Contact Info
Handitran Special Transit Division, City of Arlington
501 West Sanford, Suite 10
P.O. Box 231, Mail Stop 29-0100
Arlington, TX 76004-0231
817-459-5390
Selected Public Transportation Stats
The following tables and charts give a financial and operations overview of the public transportation network in Arlington.
Source: Federal Transit Administration - National Transit Database (1996-1998) and Synergos Technologies, Inc.
System Wide Information
General Information Service Area Statistics Square Miles Population Service Consumption Annual Passenger Miles Annual Unlinked Trips Average Weekday Unlinked Trips Average Saturday Unlinked Trips Average Sunday Unlinked Trips Service Supplied Annual Vehicle Revenue Miles Annual Vehicle Revenue Hours Veh. Available for Max. Service Veh. Operated in Max. Service Base Period Requirement Financial Information Fare Revenues Earned Directly Operated Purchased Transportation Total Fare Revenues Earned Sources of Operating Funds Expended Passenger Fares Local Funds State Funds Federal Assistance Other Funds Total Operating Funds Expended Summary of Operating Expenses Salaries, Wages and Benefits Materials and Supplies Purchased Transportation * Other Operating Expenses Total Operating Expenses Reconciling Cash Expenditures Sources of Capital Funds Local Funds State Funds Federal Assistance Total Sources Uses of Capital Funds Rolling Stock Facilites and Other Total Uses | 1997 96 267,000 645,669 92,817 342 146 0 567,120 39,650 22 17 0 82,804 19,293 102,097 82,804 317,018 316,939 633,878 0 1,350,639 951,675 52,934 186,773 143,558 1,334,940 15,699 9,025 16,758 103,126 128,909 111,552 17,357 128,909 | 1998 96 267,000 717,275 102,714 380 157 0 629,505 43,109 24 19 0 64,743 25,959 90,702 90,702 365,744 296,376 695,626 0 1,448,448 995,677 45,843 257,635 133,553 1,432,708 15,740 33,845 62,856 386,808 483,509 472,328 11,181 483,509 | Change Over Prior Yr 0 0 71,606 9,897 38 11 0 62,385 3,459 2 2 0 (18,061) 6,666 (11,395) 7,898 48,726 (20,563) 61,748 0 97,809 44,002 (7,091) 70,862 (10,005) 97,768 41 24,820 46,098 283,682 354,600 360,776 (6,176) 354,600 | 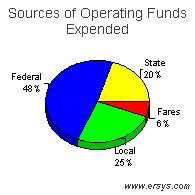 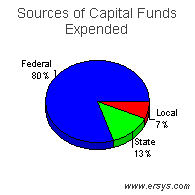 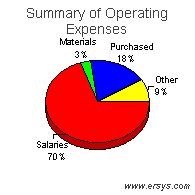 |
Mode of Transportation Breakout Information
| Demand Response | |||
| Operating Expense Capital Funding Rolling Stock Facilites and Other Annual Passenger Miles Annual Vehicle Revenue Miles Annual Vehicle Revenue Hours Annual Unlinked Trips Average Weekday Unlinked Trips Fixed Guideway Directional Route Miles Vehicles Available for Maximum Service Vehicles Operated in Maximum Service Directly Operated Purchased Transportation Average Fleet Age in Years Peak to Base Ratio Percent Spares Safety Incidents Injuries Fatalities Performance Measures Service Efficiency Operating Expense per Vehicle Revenue Mile Operating Expense per Vehicle Revenue Hour Cost Effectiveness Operating Expense per Passenger Mile Operating Expense per Unlinked Passenger Trip Service Effectiveness Unlinked Passenger Trips per Vehicle Revenue Mile Unlinked Passenger Trips per Vehicle Revenue Hour | $1,432,708 0 0 0 717,275 629,505 43,109 102,714 380 .0 24 19 13 6 .9 .0 26% 9 9 0 2.28 33.23 2.00 13.95 0.16 2.38 | $1,432,708 483,509 472,328 11,181 717,275 629,505 43,109 102,714 380 .0 24 19 13 6 .9 .0 26% 9 9 0 2.28 33.23 2.00 13.95 0.16 2.38 | $1,432,708 0 0 0 717,275 629,505 43,109 102,714 380 .0 24 19 13 6 .9 .0 26% 9 9 0 2.28 33.23 2.00 13.95 0.16 2.38 |