Public Transportation Contact Info
Sioux Falls Transit
500 East Sixth Street
Sioux Falls, SD 57103-7016
605-367-7874
Web site
Public Transportation Coverage - Bus Transport
The following map illustrates those areas of Sioux Falls that have easy access to public transportation.
Easy access is defined as no more than a one-half mile walk from a bus route. Bus stop information is ignored.
In cases of overlapping transit authorities, the transit system in review is shown in light purple and all other transit systems are shown in yellow.
Source: Federal Transit Administration and Synergos Technologies, Inc.
Selected Public Transportation Stats
The following tables and charts give a financial and operations overview of the public transportation network in Sioux Falls.
Source: Federal Transit Administration - National Transit Database (1996-1998) and Synergos Technologies, Inc.
System Wide Information
General Information Service Area Statistics Square Miles Population Service Consumption Annual Passenger Miles Annual Unlinked Trips Average Weekday Unlinked Trips Average Saturday Unlinked Trips Average Sunday Unlinked Trips Service Supplied Annual Vehicle Revenue Miles Annual Vehicle Revenue Hours Veh. Available for Max. Service Veh. Operated in Max. Service Base Period Requirement Financial Information Fare Revenues Earned Directly Operated Purchased Transportation Total Fare Revenues Earned Sources of Operating Funds Expended Passenger Fares Local Funds State Funds Federal Assistance Other Funds Total Operating Funds Expended Summary of Operating Expenses Salaries, Wages and Benefits Materials and Supplies Purchased Transportation * Other Operating Expenses Total Operating Expenses Reconciling Cash Expenditures Sources of Capital Funds Local Funds State Funds Federal Assistance Total Sources Uses of Capital Funds Rolling Stock Facilites and Other Total Uses | 1997 55 115,000 2,029,422 658,407 2,396 950 0 956,137 76,798 84 81 11 491,391 39,450 530,841 530,841 2,041,957 46,575 341,321 25,395 2,986,089 2,071,845 297,380 135,755 455,909 2,960,889 25,200 693,114 0 3,293,254 3,986,368 3,756,510 229,858 3,986,368 | 1998 55 115,000 2,650,443 678,614 2,484 994 0 999,731 81,779 87 79 11 489,056 33,215 522,271 522,271 1,715,281 46,575 857,031 26,260 3,167,418 2,271,433 285,261 154,657 456,067 3,167,418 0 96,176 0 384,703 480,879 480,879 0 480,879 | Change Over Prior Yr 0 0 621,021 20,207 88 44 0 43,594 4,981 3 (2) 0 (2,335) (6,235) (8,570) (8,570) (326,676) 0 515,710 865 181,329 199,588 (12,119) 18,902 158 206,529 (25,200) (596,938) 0 (2,908,551) (3,505,489) (3,275,631) (229,858) (3,505,489) | 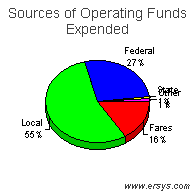 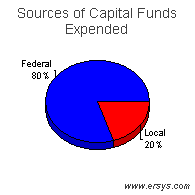 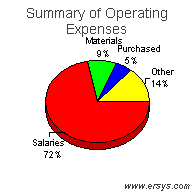 |
Mode of Transportation Breakout Information
Bus | Demand Response | |
| Operating Expense Capital Funding Rolling Stock Facilites and Other Annual Passenger Miles Annual Vehicle Revenue Miles Annual Vehicle Revenue Hours Annual Unlinked Trips Average Weekday Unlinked Trips Fixed Guideway Directional Route Miles Vehicles Available for Maximum Service Vehicles Operated in Maximum Service Directly Operated Purchased Transportation Average Fleet Age in Years Peak to Base Ratio Percent Spares Safety Incidents Injuries Fatalities Performance Measures Service Efficiency Operating Expense per Vehicle Revenue Mile Operating Expense per Vehicle Revenue Hour Cost Effectiveness Operating Expense per Passenger Mile Operating Expense per Unlinked Passenger Trip Service Effectiveness Unlinked Passenger Trips per Vehicle Revenue Mile Unlinked Passenger Trips per Vehicle Revenue Hour | $1,698,178 0 0 0 2,010,288 533,500 38,634 546,424 2,001 .0 26 21 21 0 6.1 1.9 24% 6 9 0 3.18 43.96 0.84 3.11 1.02 14.14 | $1,469,240 480,879 480,879 0 640,155 466,231 43,145 132,190 483 .0 61 58 18 40 3.5 .0 5% 7 9 0 3.15 34.05 2.30 11.11 0.28 3.06 |