Public Transportation Contact Info
Rapid Transit System
333 Sixth Street
Rapid City, SD 57701
605-394-4110
Public Transportation Coverage - Bus Transport
The following map illustrates those areas of Rapid City that have easy access to public transportation.
Easy access is defined as no more than a one-half mile walk from a bus route. Bus stop information is ignored.
In cases of overlapping transit authorities, the transit system in review is shown in light purple and all other transit systems are shown in yellow.
Source: Federal Transit Administration and Synergos Technologies, Inc.
Selected Public Transportation Stats
The following tables and charts give a financial and operations overview of the public transportation network in Rapid City.
Source: Federal Transit Administration - National Transit Database (1996-1998) and Synergos Technologies, Inc.
System Wide Information
General Information Service Area Statistics Square Miles Population Service Consumption Annual Passenger Miles Annual Unlinked Trips Average Weekday Unlinked Trips Average Saturday Unlinked Trips Average Sunday Unlinked Trips Service Supplied Annual Vehicle Revenue Miles Annual Vehicle Revenue Hours Veh. Available for Max. Service Veh. Operated in Max. Service Base Period Requirement Financial Information Fare Revenues Earned Directly Operated Purchased Transportation Total Fare Revenues Earned Sources of Operating Funds Expended Passenger Fares Local Funds State Funds Federal Assistance Other Funds Total Operating Funds Expended Summary of Operating Expenses Salaries, Wages and Benefits Materials and Supplies Purchased Transportation * Other Operating Expenses Total Operating Expenses Reconciling Cash Expenditures Sources of Capital Funds Local Funds State Funds Federal Assistance Total Sources Uses of Capital Funds Rolling Stock Facilites and Other Total Uses | 1997 34 54,523 847,352 233,247 922 20 0 333,441 25,506 18 12 0 203,029 0 203,029 203,029 243,817 28,425 272,242 0 747,513 546,726 51,245 0 120,535 718,506 29,007 16,890 0 79,065 95,955 76,650 19,305 95,955 | 1998 34 54,523 901,687 245,248 974 16 0 337,577 24,904 17 11 0 209,450 0 209,450 209,450 204,512 28,425 309,254 0 751,641 547,013 48,442 0 128,958 724,413 27,228 30,296 0 147,051 177,347 172,449 4,898 177,347 | Change Over Prior Yr 0 0 54,335 12,001 52 (4) 0 4,136 (602) (1) (1) 0 6,421 0 6,421 6,421 (39,305) 0 37,012 0 4,128 287 (2,803) 0 8,423 5,907 (1,779) 13,406 0 67,986 81,392 95,799 (14,407) 81,392 | 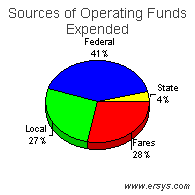 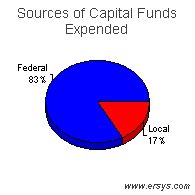 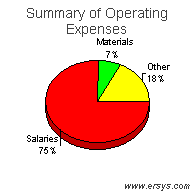 |
Mode of Transportation Breakout Information
Bus | Demand Response | |
| Operating Expense Capital Funding Rolling Stock Facilites and Other Annual Passenger Miles Annual Vehicle Revenue Miles Annual Vehicle Revenue Hours Annual Unlinked Trips Average Weekday Unlinked Trips Fixed Guideway Directional Route Miles Vehicles Available for Maximum Service Vehicles Operated in Maximum Service Directly Operated Purchased Transportation Average Fleet Age in Years Peak to Base Ratio Percent Spares Safety Incidents Injuries Fatalities Performance Measures Service Efficiency Operating Expense per Vehicle Revenue Mile Operating Expense per Vehicle Revenue Hour Cost Effectiveness Operating Expense per Passenger Mile Operating Expense per Unlinked Passenger Trip Service Effectiveness Unlinked Passenger Trips per Vehicle Revenue Mile Unlinked Passenger Trips per Vehicle Revenue Hour | $372,428 177,347 172,449 4,898 717,328 184,674 13,303 181,676 724 .0 7 4 4 0 2.4 .0 75% 1 0 0 2.02 28.00 0.52 2.05 0.98 13.66 | $351,985 0 0 0 184,359 152,903 11,601 63,572 250 .0 10 7 7 0 4.4 .0 43% 0 0 0 2.30 30.34 1.91 5.54 0.42 5.48 |