Public Transportation Contact Info
Centre Area Transportation Authority
2081 West Whitehall Road
State College, PA 16801
814-238-0625
Web site
Public Transportation Coverage - Bus Transport
The following map illustrates those areas of State College that have easy access to public transportation.
Easy access is defined as no more than a one-half mile walk from a bus route. Bus stop information is ignored.
In cases of overlapping transit authorities, the transit system in review is shown in light purple and all other transit systems are shown in yellow.
Source: Federal Transit Administration and Synergos Technologies, Inc.
Selected Public Transportation Stats
The following tables and charts give a financial and operations overview of the public transportation network in State College.
Source: Federal Transit Administration - National Transit Database (1996-1998) and Synergos Technologies, Inc.
System Wide Information
General Information Service Area Statistics Square Miles Population Service Consumption Annual Passenger Miles Annual Unlinked Trips Average Weekday Unlinked Trips Average Saturday Unlinked Trips Average Sunday Unlinked Trips Service Supplied Annual Vehicle Revenue Miles Annual Vehicle Revenue Hours Veh. Available for Max. Service Veh. Operated in Max. Service Base Period Requirement Financial Information Fare Revenues Earned Directly Operated Purchased Transportation Total Fare Revenues Earned Sources of Operating Funds Expended Passenger Fares Local Funds State Funds Federal Assistance Other Funds Total Operating Funds Expended Summary of Operating Expenses Salaries, Wages and Benefits Materials and Supplies Purchased Transportation * Other Operating Expenses Total Operating Expenses Reconciling Cash Expenditures Sources of Capital Funds Local Funds State Funds Federal Assistance Total Sources Uses of Capital Funds Rolling Stock Facilites and Other Total Uses | 1997 133 76,622 5,156,238 2,328,200 8,238 3,837 1,518 697,042 64,554 55 36 16 1,220,776 48,029 1,268,805 1,268,805 299,337 1,142,414 238,378 284,355 3,233,289 2,274,452 300,508 373,266 285,063 3,233,289 0 97,425 1,167,652 2,271,953 3,537,030 2,396,403 1,140,627 3,537,030 | 1998 133 76,622 4,287,289 2,687,147 9,759 4,176 960 794,049 76,418 63 47 23 1,462,942 170,675 1,633,617 1,633,617 291,477 1,396,172 57,222 144,640 3,523,128 2,559,696 290,283 442,309 282,110 3,574,398 (51,270) 119,300 960,620 2,628,514 3,708,434 3,353,283 355,151 3,708,434 | Change Over Prior Yr 0 0 (868,949) 358,947 1,521 339 (558) 97,007 11,864 8 11 7 242,166 122,646 364,812 364,812 (7,860) 253,758 (181,156) (139,715) 289,839 285,244 (10,225) 69,043 (2,953) 341,109 (51,270) 21,875 (207,032) 356,561 171,404 956,880 (785,476) 171,404 | 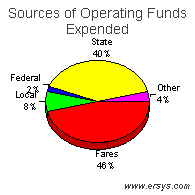 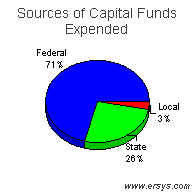 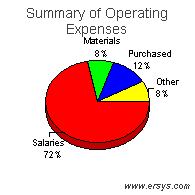 |
Mode of Transportation Breakout Information
Bus | Demand Response | |
| Operating Expense Capital Funding Rolling Stock Facilites and Other Annual Passenger Miles Annual Vehicle Revenue Miles Annual Vehicle Revenue Hours Annual Unlinked Trips Average Weekday Unlinked Trips Fixed Guideway Directional Route Miles Vehicles Available for Maximum Service Vehicles Operated in Maximum Service Directly Operated Purchased Transportation Average Fleet Age in Years Peak to Base Ratio Percent Spares Safety Incidents Injuries Fatalities Performance Measures Service Efficiency Operating Expense per Vehicle Revenue Mile Operating Expense per Vehicle Revenue Hour Cost Effectiveness Operating Expense per Passenger Mile Operating Expense per Unlinked Passenger Trip Service Effectiveness Unlinked Passenger Trips per Vehicle Revenue Mile Unlinked Passenger Trips per Vehicle Revenue Hour | $3,279,120 3,708,434 3,353,283 355,151 4,177,145 714,362 72,395 2,660,040 9,671 .0 55 40 36 4 7.7 1.7 38% 2 1 0 4.59 45.29 0.79 1.23 3.72 36.74 | $295,278 0 0 0 110,144 79,687 4,023 27,107 88 .0 8 7 0 7 4.0 .0 14% 0 0 0 3.71 73.40 2.68 10.89 0.34 6.74 |