Public Transportation Contact Info
Asheville Transit Authority
360 West Haywood Street
Asheville, NC 28801
904-389-4949
Selected Public Transportation Stats
The following tables and charts give a financial and operations overview of the public transportation network in Asheville.
Source: Federal Transit Administration - National Transit Database (1996-1998) and Synergos Technologies, Inc.
System Wide Information
General Information Service Area Statistics Square Miles Population Service Consumption Annual Passenger Miles Annual Unlinked Trips Average Weekday Unlinked Trips Average Saturday Unlinked Trips Average Sunday Unlinked Trips Service Supplied Annual Vehicle Revenue Miles Annual Vehicle Revenue Hours Veh. Available for Max. Service Veh. Operated in Max. Service Base Period Requirement Financial Information Fare Revenues Earned Directly Operated Purchased Transportation Total Fare Revenues Earned Sources of Operating Funds Expended Passenger Fares Local Funds State Funds Federal Assistance Other Funds Total Operating Funds Expended Summary of Operating Expenses Salaries, Wages and Benefits Materials and Supplies Purchased Transportation * Other Operating Expenses Total Operating Expenses Reconciling Cash Expenditures Sources of Capital Funds Local Funds State Funds Federal Assistance Total Sources Uses of Capital Funds Rolling Stock Facilites and Other Total Uses | 1997 31 64,692 3,305,431 976,437 3,364 2,280 0 718,171 59,037 30 18 9 463,432 0 463,432 463,432 856,511 205,438 360,032 40,093 1,925,506 1,217,209 194,853 228,886 284,558 1,925,506 0 0 0 0 0 0 0 0 | 1998 31 64,692 3,707,356 1,192,681 4,144 2,850 0 689,124 56,341 30 18 9 493,926 40,600 534,526 534,526 813,485 156,617 367,091 12,045 1,883,764 1,265,841 177,514 197,961 242,448 1,883,764 0 100,050 100,050 800,400 1,000,500 0 1,000,500 1,000,500 | Change Over Prior Yr (0) 0 401,925 216,244 780 570 0 (29,047) (2,696) 0 0 0 30,494 40,600 71,094 71,094 (43,026) (48,821) 7,059 (28,048) (41,742) 48,632 (17,339) (30,925) (42,110) (41,742) 0 100,050 100,050 800,400 1,000,500 0 1,000,500 1,000,500 | 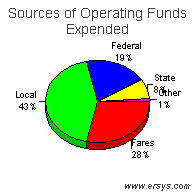 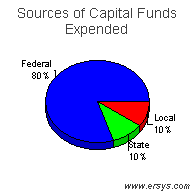 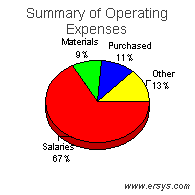 |
Mode of Transportation Breakout Information
Bus | Demand Response | |
| Operating Expense Capital Funding Rolling Stock Facilites and Other Annual Passenger Miles Annual Vehicle Revenue Miles Annual Vehicle Revenue Hours Annual Unlinked Trips Average Weekday Unlinked Trips Fixed Guideway Directional Route Miles Vehicles Available for Maximum Service Vehicles Operated in Maximum Service Directly Operated Purchased Transportation Average Fleet Age in Years Peak to Base Ratio Percent Spares Safety Incidents Injuries Fatalities Performance Measures Service Efficiency Operating Expense per Vehicle Revenue Mile Operating Expense per Vehicle Revenue Hour Cost Effectiveness Operating Expense per Passenger Mile Operating Expense per Unlinked Passenger Trip Service Effectiveness Unlinked Passenger Trips per Vehicle Revenue Mile Unlinked Passenger Trips per Vehicle Revenue Hour | $1,685,803 1,000,500 0 1,000,500 3,532,169 513,937 39,661 1,165,614 4,040 .0 16 12 12 0 2.0 1.3 33% 3 2 0 3.28 42.51 0.48 1.45 2.27 29.39 | $197,961 0 0 0 175,187 175,187 16,680 27,067 104 .0 14 6 0 6 2.7 .0 133% 0 0 0 1.13 11.87 1.13 7.31 0.15 1.62 |