Public Transportation Contact Info
Las Cruces Area Transit - RoadRUNNER
City of Las Cruces
P.O. BOX 20000
Las Cruces, NM 88004-2380
505-541-2500
Web site
Public Transportation Coverage - Bus Transport
The following map illustrates those areas of Las Cruces that have easy access to public transportation.
Easy access is defined as no more than a one-half mile walk from a bus route. Bus stop information is ignored.
In cases of overlapping transit authorities, the transit system in review is shown in light purple and all other transit systems are shown in yellow.
Source: Federal Transit Administration and Synergos Technologies, Inc.
Selected Public Transportation Stats
The following tables and charts give a financial and operations overview of the public transportation network in Las Cruces.
Source: Federal Transit Administration - National Transit Database (1996-1998) and Synergos Technologies, Inc.
System Wide Information
General Information Service Area Statistics Square Miles Population Service Consumption Annual Passenger Miles Annual Unlinked Trips Average Weekday Unlinked Trips Average Saturday Unlinked Trips Average Sunday Unlinked Trips Service Supplied Annual Vehicle Revenue Miles Annual Vehicle Revenue Hours Veh. Available for Max. Service Veh. Operated in Max. Service Base Period Requirement Financial Information Fare Revenues Earned Directly Operated Purchased Transportation Total Fare Revenues Earned Sources of Operating Funds Expended Passenger Fares Local Funds State Funds Federal Assistance Other Funds Total Operating Funds Expended Summary of Operating Expenses Salaries, Wages and Benefits Materials and Supplies Purchased Transportation * Other Operating Expenses Total Operating Expenses Reconciling Cash Expenditures Sources of Capital Funds Local Funds State Funds Federal Assistance Total Sources Uses of Capital Funds Rolling Stock Facilites and Other Total Uses | 1997 57 62,126 2,177,571 659,013 2,347 1,164 0 485,643 42,354 24 18 0 125,592 0 125,592 241,224 1,164,878 0 219,572 300 1,625,974 1,258,167 194,186 0 166,168 1,618,521 7,453 15,327 0 20,942 36,269 0 36,269 36,269 | 1998 57 62,126 2,368,492 659,035 2,353 1,135 0 505,080 44,440 24 18 10 129,134 0 129,134 263,543 1,242,336 0 197,879 325 1,704,083 1,339,389 179,158 0 185,536 1,704,083 0 23,023 0 39,768 62,791 0 62,791 62,791 | Change Over Prior Yr 0 0 190,921 22 6 (29) 0 19,437 2,086 0 0 10 3,542 0 3,542 22,319 77,458 0 (21,693) 25 78,109 81,222 (15,028) 0 19,368 85,562 (7,453) 7,696 0 18,826 26,522 0 26,522 26,522 | 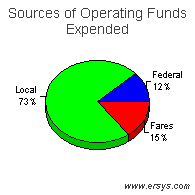 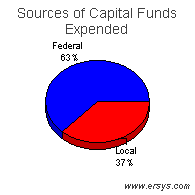 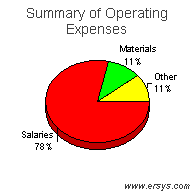 |
Mode of Transportation Breakout Information
Bus | Demand Response | |
| Operating Expense Capital Funding Rolling Stock Facilites and Other Annual Passenger Miles Annual Vehicle Revenue Miles Annual Vehicle Revenue Hours Annual Unlinked Trips Average Weekday Unlinked Trips Fixed Guideway Directional Route Miles Vehicles Available for Maximum Service Vehicles Operated in Maximum Service Directly Operated Purchased Transportation Average Fleet Age in Years Peak to Base Ratio Percent Spares Safety Incidents Injuries Fatalities Performance Measures Service Efficiency Operating Expense per Vehicle Revenue Mile Operating Expense per Vehicle Revenue Hour Cost Effectiveness Operating Expense per Passenger Mile Operating Expense per Unlinked Passenger Trip Service Effectiveness Unlinked Passenger Trips per Vehicle Revenue Mile Unlinked Passenger Trips per Vehicle Revenue Hour | $1,231,031 12,904 0 12,904 2,208,255 389,250 31,071 613,427 2,177 .0 15 10 10 0 8.1 1.0 50% 0 0 0 3.16 39.62 0.56 2.01 1.58 19.74 | $473,052 49,887 0 49,887 160,237 115,830 13,369 45,608 176 .0 9 8 8 0 5.2 .0 13% 0 0 0 4.08 35.38 2.95 10.37 0.39 3.41 |