|
|
Rio Arriba County |
Migration by Number of Persons | ||||||||
|
|
|||||||||
| Over 475 | 150 to 475 | 50 to 150 | 25 to 50 | ||||||
| -1 to 25 | -25 to -1 | -75 to -25 | -250 to -75 | Under -250 | |||||

| |||||||||
Overview
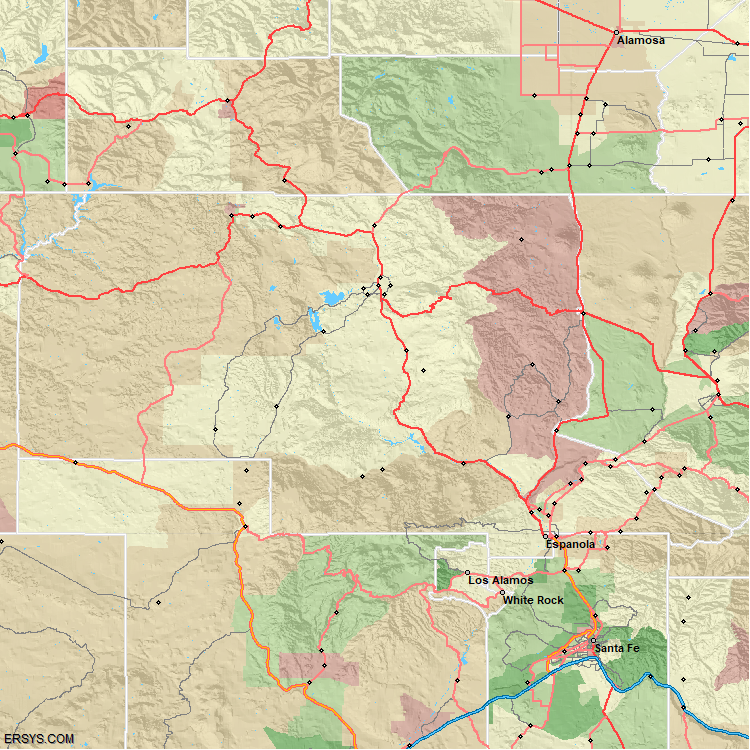
Population growth is traditionally defined as births less deaths plus or minus migration. The map on the left shows what happens when you remove births and deaths from the equation.
In this map, we see those areas that are growing by a shear influx of new persons to the area. This has important implications for retailers, because they can better see how many new people are in present in their trade area.
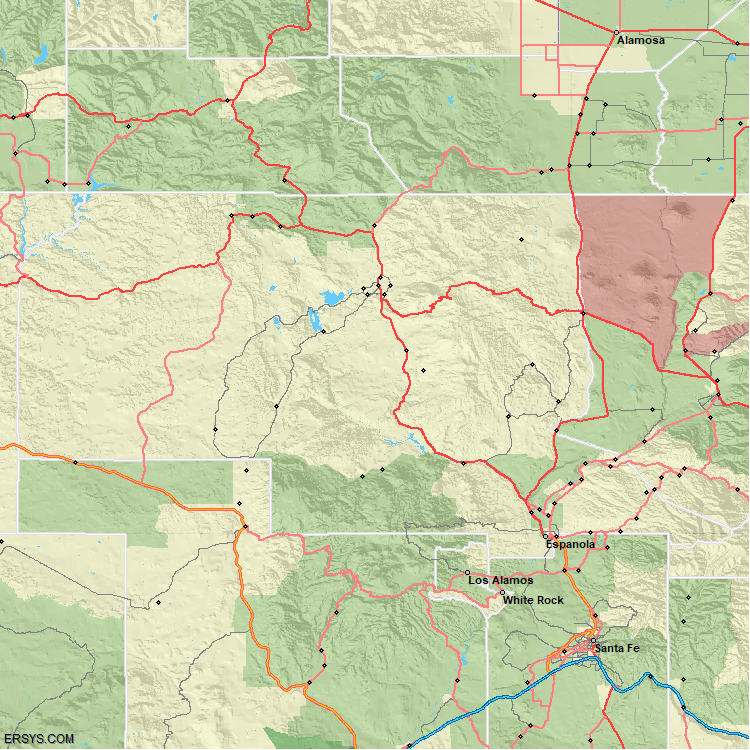
It's interesting to compare this map to a population growth map, shown below, so that you can see the type of growth occurring in an area.
Sources: STI: PopStats, Circa April 2025
Population Growth


