Public Transportation Contact Info
New Jersey Transit
NJ Transit Headquarters
One Penn Plaza, East
Newark, NJ 07105-2246
973-491-7000
Web site
Public Transportation Coverage - Bus Transport
The following map illustrates those areas of Newark that have easy access to public transportation.
Easy access is defined as no more than a one-half mile walk from a bus route. Bus stop information is ignored.
In cases of overlapping transit authorities, the transit system in review is shown in light purple and all other transit systems are shown in yellow.
Source: Federal Transit Administration and Synergos Technologies, Inc.
Selected Public Transportation Stats
The following tables and charts give a financial and operations overview of the public transportation network in Newark.
Source: Federal Transit Administration - National Transit Database (1996-1998) and Synergos Technologies, Inc.
System Wide Information
General Information Service Area Statistics Square Miles Population Service Consumption Annual Passenger Miles Annual Unlinked Trips Average Weekday Unlinked Trips Average Saturday Unlinked Trips Average Sunday Unlinked Trips Service Supplied Annual Vehicle Revenue Miles Annual Vehicle Revenue Hours Veh. Available for Max. Service Veh. Operated in Max. Service Base Period Requirement Financial Information Fare Revenues Earned Directly Operated Purchased Transportation Total Fare Revenues Earned Sources of Operating Funds Expended Passenger Fares Local Funds State Funds Federal Assistance Other Funds Total Operating Funds Expended Summary of Operating Expenses Salaries, Wages and Benefits Materials and Supplies Purchased Transportation * Other Operating Expenses Total Operating Expenses Reconciling Cash Expenditures Sources of Capital Funds Local Funds State Funds Federal Assistance Total Sources Uses of Capital Funds Rolling Stock Facilites and Other Total Uses | 1997 6,559 7,495,000 2,003,774,807 197,376,087 680,644 289,619 143,787 115,423,759 6,087,205 3,225 2,575 1,176 397,328,656 10,782,146 408,110,802 374,098,043 10,361,649 345,750,594 60,579,973 66,106,912 856,897,171 526,122,927 99,159,232 36,809,833 132,641,402 794,733,394 56,302,107 13,083,325 176,589,331 329,329,000 519,001,656 94,914,175 424,087,481 519,001,656 | 1998 6,559 7,495,000 2,077,160,501 206,459,470 711,522 303,106 163,888 120,078,526 6,131,485 3,375 2,782 1,112 410,230,335 11,662,126 421,892,461 421,892,461 13,361,058 302,623,804 49,727,740 67,239,262 854,844,325 532,620,633 100,763,595 55,127,252 117,013,213 805,524,693 49,319,632 30,204,285 159,170,342 226,382,373 415,757,000 24,822,537 390,934,463 415,757,000 | Change Over Prior Yr 0 0 73,385,694 9,083,383 30,878 13,487 20,101 4,654,767 44,280 150 207 (64) 12,901,679 879,980 13,781,659 47,794,418 2,999,409 (43,126,790) (10,852,233) 1,132,350 (2,052,846) 6,497,706 1,604,363 18,317,419 (15,628,189) 10,791,299 (6,982,475) 17,120,960 (17,418,989) (102,946,627) (103,244,656) (70,091,638) (33,153,018) (103,244,656) | 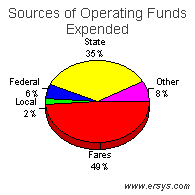 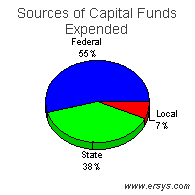 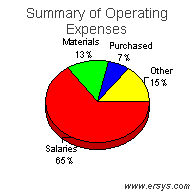 |
Mode of Transportation Breakout Information
Bus | Light Rail | Commuter Rail | Demand Response | |
| Operating Expense Capital Funding Rolling Stock Facilites and Other Annual Passenger Miles Annual Vehicle Revenue Miles Annual Vehicle Revenue Hours Annual Unlinked Trips Average Weekday Unlinked Trips Fixed Guideway Directional Route Miles Vehicles Available for Maximum Service Vehicles Operated in Maximum Service Directly Operated Purchased Transportation Average Fleet Age in Years Peak to Base Ratio Percent Spares Safety Incidents Injuries Fatalities Performance Measures Service Efficiency Operating Expense per Vehicle Revenue Mile Operating Expense per Vehicle Revenue Hour Cost Effectiveness Operating Expense per Passenger Mile Operating Expense per Unlinked Passenger Trip Service Effectiveness Unlinked Passenger Trips per Vehicle Revenue Mile Unlinked Passenger Trips per Vehicle Revenue Hour | $430,166,999 123,656,552 9,244,089 114,412,463 852,125,093 69,756,138 4,515,334 145,491,539 498,658 50.4 2,087 1,757 1,606 151 11.3 2.1 19% 1,660 1,811 2 6.17 95.27 0.50 2.96 2.09 32.22 | $6,959,110 272,576,133 15,578,448 256,997,685 12,584,586 649,787 42,058 4,444,794 15,227 8.3 22 16 16 0 51.5 2.3 38% 6 6 0 10.71 165.46 0.55 1.57 6.84 105.68 | $355,955,426 19,524,315 0 19,524,315 1,193,311,980 44,087,372 1,313,776 55,881,360 193,690 1192.8 928 729 684 45 18.5 2.4 27% 63 16 26 8.07 270.94 0.30 6.37 1.27 42.53 | $11,458,275 0 0 0 1,960,632 3,407,823 210,547 249,917 837 .0 156 98 0 98 3.4 .0 59% 44 10 0 3.36 54.42 5.84 45.85 0.07 1.19 |