Public Transportation Contact Info
Minneapolis-St. Paul Metropolitan Council, Metro Transit Division
560 Sixth Avenue, North
Minneapolis, MN 55411-4398
612-349-7510
Web site
Public Transportation Coverage - Bus Transport
The following map illustrates those areas of Minneapolis that have easy access to public transportation.
Easy access is defined as no more than a one-half mile walk from a bus route. Bus stop information is ignored.
In cases of overlapping transit authorities, the transit system in review is shown in light purple and all other transit systems are shown in yellow.
Source: Federal Transit Administration and Synergos Technologies, Inc.
Selected Public Transportation Stats
The following tables and charts give a financial and operations overview of the public transportation network in Minneapolis.
Source: Federal Transit Administration - National Transit Database (1996-1998) and Synergos Technologies, Inc.
System Wide Information
General Information Service Area Statistics Square Miles Population Service Consumption Annual Passenger Miles Annual Unlinked Trips Average Weekday Unlinked Trips Average Saturday Unlinked Trips Average Sunday Unlinked Trips Service Supplied Annual Vehicle Revenue Miles Annual Vehicle Revenue Hours Veh. Available for Max. Service Veh. Operated in Max. Service Base Period Requirement Financial Information Fare Revenues Earned Directly Operated Purchased Transportation Total Fare Revenues Earned Sources of Operating Funds Expended Passenger Fares Local Funds State Funds Federal Assistance Other Funds Total Operating Funds Expended Summary of Operating Expenses Salaries, Wages and Benefits Materials and Supplies Purchased Transportation * Other Operating Expenses Total Operating Expenses Reconciling Cash Expenditures Sources of Capital Funds Local Funds State Funds Federal Assistance Total Sources Uses of Capital Funds Rolling Stock Facilites and Other Total Uses | 1997 1,105 2,213,143 265,870,588 62,065,357 206,140 109,673 65,468 22,961,362 1,660,139 894 755 288 53,013,760 5,797 53,019,557 53,019,557 50,894,924 20,241,286 5,645,178 4,548,691 134,349,636 107,261,879 12,998,394 164,352 13,676,549 134,101,174 248,462 5,281,509 2,331 3,958,895 9,242,735 3,350,194 5,892,541 9,242,735 | 1998 1,105 2,233,497 250,695,430 66,048,771 218,897 116,805 69,898 23,658,284 1,692,391 916 773 293 54,287,150 9,752 54,296,902 54,296,902 62,123,787 29,020,603 2,292,922 3,521,919 151,256,133 121,742,184 16,138,197 165,636 12,787,163 150,833,180 422,953 20,939,402 110,277 41,599,471 62,649,150 36,951,412 25,697,738 62,649,150 | Change Over Prior Yr 0 20,354 (15,175,158) 3,983,414 12,757 7,132 4,430 696,922 32,252 22 18 5 1,273,390 3,955 1,277,345 1,277,345 11,228,863 8,779,317 (3,352,256) (1,026,772) 16,906,497 14,480,305 3,139,803 1,284 (889,386) 16,732,006 174,491 15,657,893 107,946 37,640,576 53,406,415 33,601,218 19,805,197 53,406,415 | 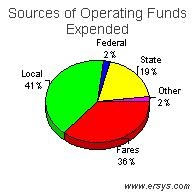 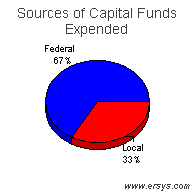 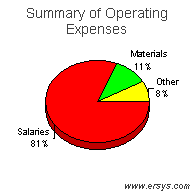 |
Mode of Transportation Breakout Information
Bus | |
| Operating Expense Capital Funding Rolling Stock Facilites and Other Annual Passenger Miles Annual Vehicle Revenue Miles Annual Vehicle Revenue Hours Annual Unlinked Trips Average Weekday Unlinked Trips Fixed Guideway Directional Route Miles Vehicles Available for Maximum Service Vehicles Operated in Maximum Service Directly Operated Purchased Transportation Average Fleet Age in Years Peak to Base Ratio Percent Spares Safety Incidents Injuries Fatalities Performance Measures Service Efficiency Operating Expense per Vehicle Revenue Mile Operating Expense per Vehicle Revenue Hour Cost Effectiveness Operating Expense per Passenger Mile Operating Expense per Unlinked Passenger Trip Service Effectiveness Unlinked Passenger Trips per Vehicle Revenue Mile Unlinked Passenger Trips per Vehicle Revenue Hour | $150,833,180 62,649,150 36,951,412 25,697,738 250,695,430 23,658,284 1,692,391 66,048,771 218,897 147.1 916 773 769 4 6.2 2.6 18% 515 764 1 6.38 89.12 0.60 2.28 2.79 39.03 |