Public Transportation Contact Info
Brockton Area Transit Authority
70 School Street
Brockton, MA 02401-4097
508-588-2240
Public Transportation Coverage - Bus Transport
The following map illustrates those areas of Brockton that have easy access to public transportation.
Easy access is defined as no more than a one-half mile walk from a bus route. Bus stop information is ignored.
In cases of overlapping transit authorities, the transit system in review is shown in light purple and all other transit systems are shown in yellow.
Source: Federal Transit Administration and Synergos Technologies, Inc.
Selected Public Transportation Stats
The following tables and charts give a financial and operations overview of the public transportation network in Brockton.
Source: Federal Transit Administration - National Transit Database (1996-1998) and Synergos Technologies, Inc.
System Wide Information
General Information Service Area Statistics Square Miles Population Service Consumption Annual Passenger Miles Annual Unlinked Trips Average Weekday Unlinked Trips Average Saturday Unlinked Trips Average Sunday Unlinked Trips Service Supplied Annual Vehicle Revenue Miles Annual Vehicle Revenue Hours Veh. Available for Max. Service Veh. Operated in Max. Service Base Period Requirement Financial Information Fare Revenues Earned Directly Operated Purchased Transportation Total Fare Revenues Earned Sources of Operating Funds Expended Passenger Fares Local Funds State Funds Federal Assistance Other Funds Total Operating Funds Expended Summary of Operating Expenses Salaries, Wages and Benefits Materials and Supplies Purchased Transportation * Other Operating Expenses Total Operating Expenses Reconciling Cash Expenditures Sources of Capital Funds Local Funds State Funds Federal Assistance Total Sources Uses of Capital Funds Rolling Stock Facilites and Other Total Uses | 1997 114 176,677 17,029,372 3,645,148 13,117 6,532 0 2,180,632 169,696 89 82 0 0 3,190,024 3,190,024 3,190,024 1,300,422 3,826,972 944,121 416,719 9,678,258 0 0 9,491,316 0 9,491,316 186,942 0 224,863 69,461 294,324 0 294,324 294,324 | 1998 114 176,677 18,980,932 3,709,548 13,465 6,084 0 2,203,700 159,496 89 82 48 0 3,365,009 3,365,009 3,365,009 1,438,779 4,067,263 932,245 164,856 9,968,152 0 0 9,706,328 0 9,706,328 261,824 0 879,129 882,455 1,761,584 311,406 1,450,178 1,761,584 | Change Over Prior Yr 0 0 1,951,560 64,400 348 (448) 0 23,068 (10,200) 0 0 48 0 174,985 174,985 174,985 138,357 240,291 (11,876) (251,863) 289,894 0 0 215,012 0 215,012 74,882 0 654,266 812,994 1,467,260 311,406 1,155,854 1,467,260 | 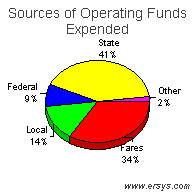 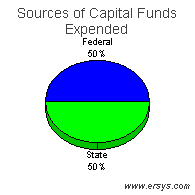 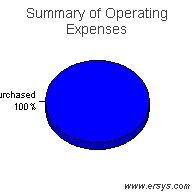 |
Mode of Transportation Breakout Information
Bus | Demand Response | |
| Operating Expense Capital Funding Rolling Stock Facilites and Other Annual Passenger Miles Annual Vehicle Revenue Miles Annual Vehicle Revenue Hours Annual Unlinked Trips Average Weekday Unlinked Trips Fixed Guideway Directional Route Miles Vehicles Available for Maximum Service Vehicles Operated in Maximum Service Directly Operated Purchased Transportation Average Fleet Age in Years Peak to Base Ratio Percent Spares Safety Incidents Injuries Fatalities Performance Measures Service Efficiency Operating Expense per Vehicle Revenue Mile Operating Expense per Vehicle Revenue Hour Cost Effectiveness Operating Expense per Passenger Mile Operating Expense per Unlinked Passenger Trip Service Effectiveness Unlinked Passenger Trips per Vehicle Revenue Mile Unlinked Passenger Trips per Vehicle Revenue Hour | $7,160,698 1,450,178 0 1,450,178 18,441,072 1,488,896 98,724 3,500,400 12,705 .0 52 48 0 48 6.0 1.0 8% 30 28 0 4.81 72.53 0.39 2.05 2.35 35.46 | $2,545,630 311,406 311,406 0 539,860 714,804 60,772 209,148 760 .0 37 34 0 34 5.9 .0 9% 5 4 0 3.56 41.89 4.72 12.17 0.29 3.44 |