Public Transportation Contact Info
City of Bangor
73 Harlow Street
Bangor, ME 04401
207-945-4400
Public Transportation Coverage - Bus Transport
The following map illustrates those areas of Bangor that have easy access to public transportation.
Easy access is defined as no more than a one-half mile walk from a bus route. Bus stop information is ignored.
In cases of overlapping transit authorities, the transit system in review is shown in light purple and all other transit systems are shown in yellow.
Source: Federal Transit Administration and Synergos Technologies, Inc.
Selected Public Transportation Stats
The following tables and charts give a financial and operations overview of the public transportation network in Bangor.
Source: Federal Transit Administration - National Transit Database (1996-1998) and Synergos Technologies, Inc.
System Wide Information
General Information Service Area Statistics Square Miles Population Service Consumption Annual Passenger Miles Annual Unlinked Trips Average Weekday Unlinked Trips Average Saturday Unlinked Trips Average Sunday Unlinked Trips Service Supplied Annual Vehicle Revenue Miles Annual Vehicle Revenue Hours Veh. Available for Max. Service Veh. Operated in Max. Service Base Period Requirement Financial Information Fare Revenues Earned Directly Operated Purchased Transportation Total Fare Revenues Earned Sources of Operating Funds Expended Passenger Fares Local Funds State Funds Federal Assistance Other Funds Total Operating Funds Expended Summary of Operating Expenses Salaries, Wages and Benefits Materials and Supplies Purchased Transportation * Other Operating Expenses Total Operating Expenses Reconciling Cash Expenditures Sources of Capital Funds Local Funds State Funds Federal Assistance Total Sources Uses of Capital Funds Rolling Stock Facilites and Other Total Uses | 1997 71 61,402 1,650,707 389,385 1,363 940 0 444,318 28,658 12 11 10 233,333 0 233,333 233,333 346,949 36,490 153,072 14,616 784,460 601,871 151,115 2,776 28,698 784,460 0 2,709 0 10,822 13,531 0 13,531 13,531 | 1998 71 61,402 1,729,241 413,880 1,444 875 0 445,444 28,766 12 11 10 257,225 255 257,480 257,480 248,537 37,000 219,291 11,128 773,436 603,840 126,663 1,538 41,395 773,436 0 20,292 11,053 101,460 132,805 126,253 6,552 132,805 | Change Over Prior Yr 0 0 78,534 24,495 81 (65) 0 1,126 108 0 0 0 23,892 255 24,147 24,147 (98,412) 510 66,219 (3,488) (11,024) 1,969 (24,452) (1,238) 12,697 (11,024) 0 17,583 11,053 90,638 119,274 126,253 (6,979) 119,274 | 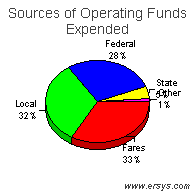 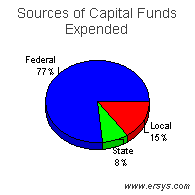 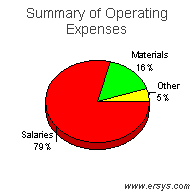 |
Mode of Transportation Breakout Information
Bus | Demand Response | |
| Operating Expense Capital Funding Rolling Stock Facilites and Other Annual Passenger Miles Annual Vehicle Revenue Miles Annual Vehicle Revenue Hours Annual Unlinked Trips Average Weekday Unlinked Trips Fixed Guideway Directional Route Miles Vehicles Available for Maximum Service Vehicles Operated in Maximum Service Directly Operated Purchased Transportation Average Fleet Age in Years Peak to Base Ratio Percent Spares Safety Incidents Injuries Fatalities Performance Measures Service Efficiency Operating Expense per Vehicle Revenue Mile Operating Expense per Vehicle Revenue Hour Cost Effectiveness Operating Expense per Passenger Mile Operating Expense per Unlinked Passenger Trip Service Effectiveness Unlinked Passenger Trips per Vehicle Revenue Mile Unlinked Passenger Trips per Vehicle Revenue Hour | $771,898 132,805 126,253 6,552 1,728,406 444,609 28,714 413,720 1,444 .0 11 10 10 0 9.0 1.0 10% 3 0 0 1.74 26.88 0.45 1.87 0.93 14.41 | $1,538 0 0 0 835 835 52 160 0 .0 1 1 0 1 1.0 .0 % 0 0 0 1.84 29.58 1.84 9.61 0.19 3.08 |