Public Transportation Contact Info
Topeka Metropolitan Transit Authority
201 North Kansas Avenue
Topeka, KS 66603-3622
913-233-2011
Web site
Public Transportation Coverage - Bus Transport
The following map illustrates those areas of Topeka that have easy access to public transportation.
Easy access is defined as no more than a one-half mile walk from a bus route. Bus stop information is ignored.
In cases of overlapping transit authorities, the transit system in review is shown in light purple and all other transit systems are shown in yellow.
Source: Federal Transit Administration and Synergos Technologies, Inc.
Selected Public Transportation Stats
The following tables and charts give a financial and operations overview of the public transportation network in Topeka.
Source: Federal Transit Administration - National Transit Database (1996-1998) and Synergos Technologies, Inc.
System Wide Information
General Information Service Area Statistics Square Miles Population Service Consumption Annual Passenger Miles Annual Unlinked Trips Average Weekday Unlinked Trips Average Saturday Unlinked Trips Average Sunday Unlinked Trips Service Supplied Annual Vehicle Revenue Miles Annual Vehicle Revenue Hours Veh. Available for Max. Service Veh. Operated in Max. Service Base Period Requirement Financial Information Fare Revenues Earned Directly Operated Purchased Transportation Total Fare Revenues Earned Sources of Operating Funds Expended Passenger Fares Local Funds State Funds Federal Assistance Other Funds Total Operating Funds Expended Summary of Operating Expenses Salaries, Wages and Benefits Materials and Supplies Purchased Transportation * Other Operating Expenses Total Operating Expenses Reconciling Cash Expenditures Sources of Capital Funds Local Funds State Funds Federal Assistance Total Sources Uses of Capital Funds Rolling Stock Facilites and Other Total Uses | 1997 151 145,000 4,552,842 1,305,118 4,711 2,087 0 1,078,766 70,242 68 36 13 613,646 6,188 619,834 619,834 1,569,536 100,000 680,423 125,970 3,095,763 2,121,743 604,217 48,694 317,203 3,091,857 3,906 63,828 37,494 224,428 325,750 4,075 321,675 325,750 | 1998 151 145,000 4,640,459 1,319,930 4,750 2,090 0 1,127,085 73,862 72 41 13 606,444 18,145 624,589 624,589 1,927,934 0 563,773 131,114 3,247,410 2,232,499 568,496 91,153 351,299 3,243,447 3,963 362,983 49,414 1,402,446 1,814,843 7,364 1,807,479 1,814,843 | Change Over Prior Yr 0 0 87,617 14,812 39 3 0 48,319 3,620 4 5 0 (7,202) 11,957 4,755 4,755 358,398 (100,000) (116,650) 5,144 151,647 110,756 (35,721) 42,459 34,096 151,590 57 299,155 11,920 1,178,018 1,489,093 3,289 1,485,804 1,489,093 | 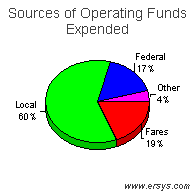 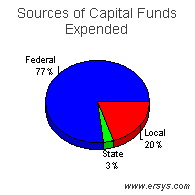 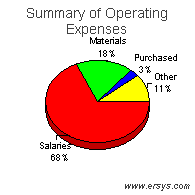 |
Mode of Transportation Breakout Information
Bus | Demand Response | |
| Operating Expense Capital Funding Rolling Stock Facilites and Other Annual Passenger Miles Annual Vehicle Revenue Miles Annual Vehicle Revenue Hours Annual Unlinked Trips Average Weekday Unlinked Trips Fixed Guideway Directional Route Miles Vehicles Available for Maximum Service Vehicles Operated in Maximum Service Directly Operated Purchased Transportation Average Fleet Age in Years Peak to Base Ratio Percent Spares Safety Incidents Injuries Fatalities Performance Measures Service Efficiency Operating Expense per Vehicle Revenue Mile Operating Expense per Vehicle Revenue Hour Cost Effectiveness Operating Expense per Passenger Mile Operating Expense per Unlinked Passenger Trip Service Effectiveness Unlinked Passenger Trips per Vehicle Revenue Mile Unlinked Passenger Trips per Vehicle Revenue Hour | $2,579,517 1,814,843 7,364 1,807,479 4,196,791 844,070 56,252 1,271,851 4,569 .0 31 23 23 0 10.0 1.8 35% 5 2 1 3.06 45.86 0.61 2.03 1.51 22.61 | $663,930 0 0 0 443,668 283,015 17,610 48,079 181 .0 41 18 6 12 9.0 .0 128% 4 4 0 2.35 37.70 1.50 13.81 0.17 2.73 |