Public Transportation Contact Info
Pinellas Suncoast Transit Authority
14840 49th Street, North
Clearwater, FL 33762-2893
813-530-9921
Public Transportation Coverage - Bus Transport
The following map illustrates those areas of St. Petersburg that have easy access to public transportation.
Easy access is defined as no more than a one-half mile walk from a bus route. Bus stop information is ignored.
In cases of overlapping transit authorities, the transit system in review is shown in light purple and all other transit systems are shown in yellow.
Source: Federal Transit Administration and Synergos Technologies, Inc.
Selected Public Transportation Stats
The following tables and charts give a financial and operations overview of the public transportation network in St. Petersburg.
Source: Federal Transit Administration - National Transit Database (1996-1998) and Synergos Technologies, Inc.
System Wide Information
General Information Service Area Statistics Square Miles Population Service Consumption Annual Passenger Miles Annual Unlinked Trips Average Weekday Unlinked Trips Average Saturday Unlinked Trips Average Sunday Unlinked Trips Service Supplied Annual Vehicle Revenue Miles Annual Vehicle Revenue Hours Veh. Available for Max. Service Veh. Operated in Max. Service Base Period Requirement Financial Information Fare Revenues Earned Directly Operated Purchased Transportation Total Fare Revenues Earned Sources of Operating Funds Expended Passenger Fares Local Funds State Funds Federal Assistance Other Funds Total Operating Funds Expended Summary of Operating Expenses Salaries, Wages and Benefits Materials and Supplies Purchased Transportation * Other Operating Expenses Total Operating Expenses Reconciling Cash Expenditures Sources of Capital Funds Local Funds State Funds Federal Assistance Total Sources Uses of Capital Funds Rolling Stock Facilites and Other Total Uses | 1997 143 792,306 36,884,874 8,190,510 24,246 29,547 8,079 7,443,689 537,566 230 198 105 6,169,098 0 6,169,098 6,169,098 12,118,882 3,834,206 2,345,161 1,534,532 26,001,879 17,655,411 2,865,324 2,173,497 3,606,600 26,300,832 8,327 1,192,864 911,828 13,208,427 15,313,119 13,680,652 1,632,467 15,313,119 | 1998 209 833,504 39,590,039 9,029,111 28,345 26,401 8,255 7,465,420 543,669 230 196 107 6,719,103 327,037 7,046,140 7,046,140 13,651,169 4,375,831 444,097 1,370,355 26,887,592 17,772,193 2,569,587 2,404,469 4,141,343 26,887,592 0 0 0 2,834,577 2,834,577 1,772,198 1,062,379 2,834,577 | Change Over Prior Yr 67 41,198 2,705,165 838,601 4,099 (3,146) 176 21,731 6,103 0 (2) 2 550,005 327,037 877,042 877,042 1,532,287 541,625 (1,901,064) (164,177) 885,713 116,782 (295,737) 230,972 534,743 586,760 (8,327) (1,192,864) (911,828) (10,373,850) (12,478,542) (11,908,454) (570,088) (12,478,542) | 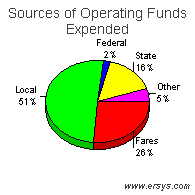 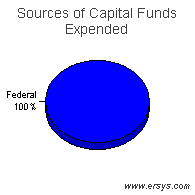 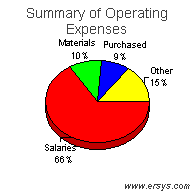 |
Mode of Transportation Breakout Information
Bus | Demand Response | |
| Operating Expense Capital Funding Rolling Stock Facilites and Other Annual Passenger Miles Annual Vehicle Revenue Miles Annual Vehicle Revenue Hours Annual Unlinked Trips Average Weekday Unlinked Trips Fixed Guideway Directional Route Miles Vehicles Available for Maximum Service Vehicles Operated in Maximum Service Directly Operated Purchased Transportation Average Fleet Age in Years Peak to Base Ratio Percent Spares Safety Incidents Injuries Fatalities Performance Measures Service Efficiency Operating Expense per Vehicle Revenue Mile Operating Expense per Vehicle Revenue Hour Cost Effectiveness Operating Expense per Passenger Mile Operating Expense per Unlinked Passenger Trip Service Effectiveness Unlinked Passenger Trips per Vehicle Revenue Mile Unlinked Passenger Trips per Vehicle Revenue Hour | $24,483,123 2,834,577 1,772,198 1,062,379 38,366,849 6,364,557 438,446 8,836,915 27,691 .0 143 109 109 0 3.6 1.0 31% 53 47 0 3.85 55.84 0.64 2.77 1.39 20.16 | $2,404,469 0 0 0 1,223,190 1,100,863 105,223 192,196 654 .0 87 87 0 87 4.5 .0 % 0 0 0 2.18 22.85 1.97 12.51 0.17 1.83 |