Public Transportation Contact Info
City of Phoenix Public Transit Department
302 N First Avenue, Ste 700
Phoenix, AZ 85003
602-262-7242
Web site
Public Transportation Coverage - Bus Transport
The following map illustrates those areas of Phoenix that have easy access to public transportation.
Easy access is defined as no more than a one-half mile walk from a bus route. Bus stop information is ignored.
In cases of overlapping transit authorities, the transit system in review is shown in light purple and all other transit systems are shown in yellow.
Source: Federal Transit Administration and Synergos Technologies, Inc.
Selected Public Transportation Stats
The following tables and charts give a financial and operations overview of the public transportation network in Phoenix.
Source: Federal Transit Administration - National Transit Database (1996-1998) and Synergos Technologies, Inc.
System Wide Information
General Information Service Area Statistics Square Miles Population Service Consumption Annual Passenger Miles Annual Unlinked Trips Average Weekday Unlinked Trips Average Saturday Unlinked Trips Average Sunday Unlinked Trips Service Supplied Annual Vehicle Revenue Miles Annual Vehicle Revenue Hours Veh. Available for Max. Service Veh. Operated in Max. Service Base Period Requirement Financial Information Fare Revenues Earned Directly Operated Purchased Transportation Total Fare Revenues Earned Sources of Operating Funds Expended Passenger Fares Local Funds State Funds Federal Assistance Other Funds Total Operating Funds Expended Summary of Operating Expenses Salaries, Wages and Benefits Materials and Supplies Purchased Transportation * Other Operating Expenses Total Operating Expenses Reconciling Cash Expenditures Sources of Capital Funds Local Funds State Funds Federal Assistance Total Sources Uses of Capital Funds Rolling Stock Facilites and Other Total Uses | 1997 416 996,166 121,985,946 31,202,363 107,857 65,588 8,064 13,135,738 923,065 468 381 246 16,453,877 0 16,453,877 16,453,877 25,128,524 12,995,334 1,840,433 2,666,925 59,085,093 36,486,803 6,850,499 8,315,625 6,352,539 58,005,466 1,079,627 1,748,951 0 7,816,621 9,565,572 801,638 8,763,934 9,565,572 | 1998 416 996,166 128,443,597 32,135,155 112,796 62,473 2,332 13,531,633 1,020,489 522 404 236 15,830,739 1,869,074 17,699,813 17,701,217 30,039,954 8,540,433 4,097,712 1,368,046 61,747,362 38,454,312 6,362,291 9,094,184 5,913,324 59,824,111 1,094,894 2,524,743 293,790 8,517,362 11,335,895 560,470 10,775,425 11,335,895 | Change Over Prior Yr 0 0 6,457,651 932,792 4,939 (3,115) (5,732) 395,895 97,424 54 23 (10) (623,138) 1,869,074 1,245,936 1,247,340 4,911,430 (4,454,901) 2,257,279 (1,298,879) 2,662,269 1,967,509 (488,208) 778,559 (439,215) 1,818,645 15,267 775,792 293,790 700,741 1,770,323 (241,168) 2,011,491 1,770,323 | 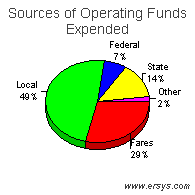 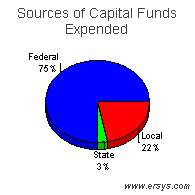 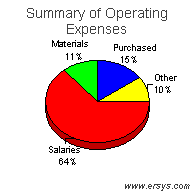 |
Mode of Transportation Breakout Information
Bus | Demand Response | |
| Operating Expense Capital Funding Rolling Stock Facilites and Other Annual Passenger Miles Annual Vehicle Revenue Miles Annual Vehicle Revenue Hours Annual Unlinked Trips Average Weekday Unlinked Trips Fixed Guideway Directional Route Miles Vehicles Available for Maximum Service Vehicles Operated in Maximum Service Directly Operated Purchased Transportation Average Fleet Age in Years Peak to Base Ratio Percent Spares Safety Incidents Injuries Fatalities Performance Measures Service Efficiency Operating Expense per Vehicle Revenue Mile Operating Expense per Vehicle Revenue Hour Cost Effectiveness Operating Expense per Passenger Mile Operating Expense per Unlinked Passenger Trip Service Effectiveness Unlinked Passenger Trips per Vehicle Revenue Mile Unlinked Passenger Trips per Vehicle Revenue Hour | $54,121,572 11,335,895 560,470 10,775,425 125,661,932 10,896,286 830,438 31,768,156 111,516 58.5 415 315 275 40 11.2 1.3 32% 143 171 0 4.97 65.17 0.43 1.70 2.92 38.25 | $5,702,539 0 0 0 2,781,665 2,635,347 190,051 366,999 1,280 .0 107 89 0 89 3.0 .0 20% 58 12 0 2.16 30.01 2.05 15.54 0.14 1.93 |